Dashboard
View Your Sales Numbers with Ease
View a snapshot of your business performance with the Dashboard. Track payments, customers, activity, and trends by day, week, month, year, or lifetime.
Overview
This is a snapshot of your business' payments for a particular time period. This snapshot can assist with identifying high and low volume time periods, marketing campaigns, and determining staffing needs. The dashboard opens with a view of the current month’s payments and customers with the option to view your preferred day, week, month, year or lifetime.
Limitations
- The dashboard is only visible to admin and supervisor roles. Dashboard data is only available since the account began processing with MX™ Merchant.
Dashboard Graphs
As soon as you log into MX Merchant, you will enter the Dashboard tab automatically. You can come back to this section simply by pressing the Dashboard tab in the left-hand navigation menu.
In thsi section, you will find the following graphs:
You can see data for different time periods (Today, Week, Month, Year, or Lifetime) by clicking on the dropdown menu in the middle.
Payments and Customers Graphs
The Payments and Customers graphs are found at the top of the window. These graphs show the the net income and the number of customers serviced respectively.
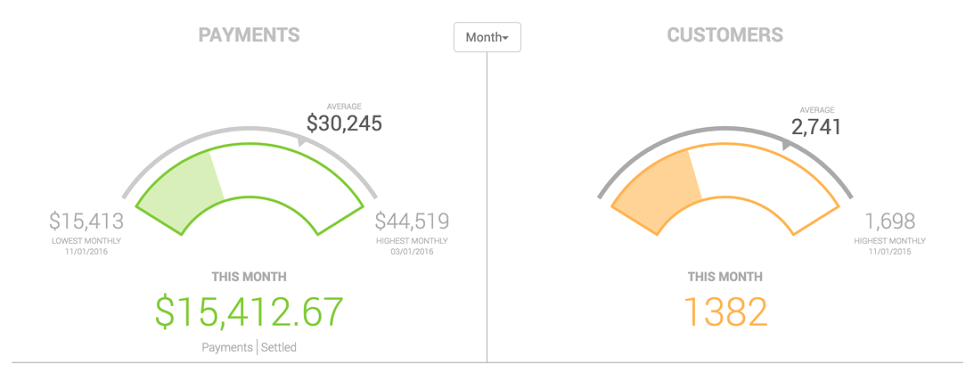
Payments Graph
This graph in green shows the net income for the account. Depending on the selected time frame, if shows the following:
- Today - Displays the lowest payment total of record for the current day and the current average payment total for the day on the meter. The current day’s net payment total is displayed below the meter.
- Week - displays the lowest weekly payment total of registered (since starting processing with MX™ Merchant) and the average weekly payment total of record on the meter. The current week’s net payment total is displayed below the meter.
- Month - displays the lowest monthly payment total registered (since starting processing with MX™ Merchant) and the average monthly payment total of record on the meter. The current month's net payment total is displayed below the meter.
- Year - displays the lowest yearly total registered (since starting processing with MX™ Merchant) and the average yearly payment total of record on the meter. The current year’s net payment total is displayed below the meter.
- Lifetime - displays the lowest monthly payment total registered (since starting processing with MX™ Merchant) and the average monthly payment total of record on the meter. The payment total for the lifetime of the account.
Notes:
- At the bottom of the graph, you'll find the net amount of transactions for the time period selected; as that increases, so will the green bar in the payment graph.
- Below the total amount, you will see the words Payments and Settled. Clicking on these will switch the view between all payments in MX™ Merchant and total settled data.
- If your account only processes outside of MX™ Merchant, you will see the first graph shows Settled Payment numbers only.
Customer Graph
In contrast to the Payment graph, this graph shows the total number of unique customers serviced. Depending on the selected time frame, if shows the following:
- Today - displays the lowest daily unique customer count registered (since starting processing with MX™ Merchant) and the average daily, unique customer count registered on the meter. Below the meter is the unique customer count for the day.
- Week - displays the lowest weekly unique customer count registered (since starting processing with MX™ Merchant) and the average weekly, unique customer count registered on the meter. Below the meter is the unique customer count for the week.
- Month - displays the lowest monthly, unique customer count registered (since starting processing with MX™ Merchant) and the average monthly, unique customer count registered on the meter. Below the meter is the unique customer count for the current month.
- Year - displays the lowest yearly unique customer count registered (since starting processing with MX™ Merchant) and the average yearly, unique customer count registered on the meter. Below the meter is the unique customer count for the current year.
- Lifetime - displays the lowest monthly unique customer count registered (since starting processing with MX™ Merchant) and the average yearly unique customer count registered on the meter. Below the meter is the unique customer count for the lifetime of the account.
Activity Graph
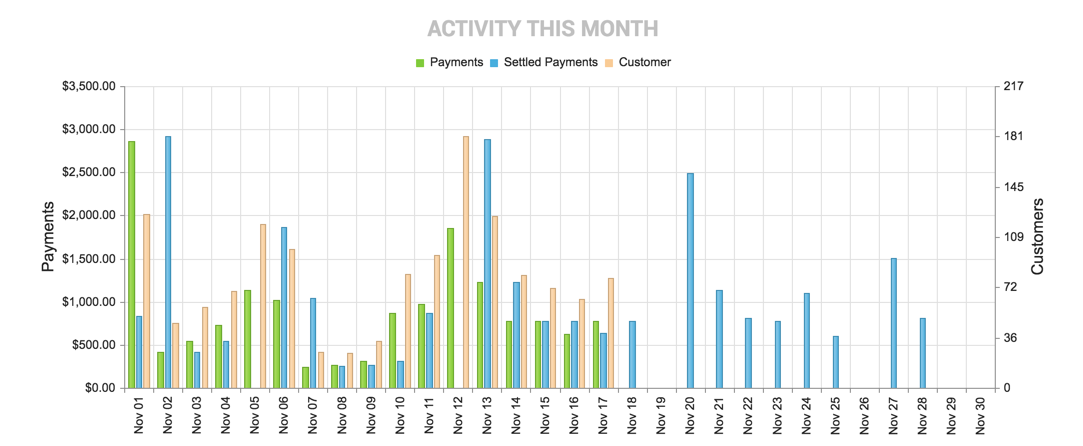
In addition to the separate payment and customer graphs, the dashboard provides a combined payment and customer graph. When you hover over the graph a grey box appears displaying the time, total net amount of payments and number of customers for that given time. This graph can be organized by day, week, month or year by clicking the drop down between the payment and customer graph.
- Today - displays the number of unique customers and payments by the hour for the current day.
- Week - displays the number of unique customers and payments by day for the current week.
- Month - displays the number of unique customers and payments by day for the current month.
- Year - displays the number of unique customers and payments by month for the current year.
- Lifetime - displays the number of unique customers and payments by month for the entire lifetime of the account.
Note:
The default graph shows payments only, but you may select the Customers at the top to add customers to the graph.
Customer Composition Graph

In the settings, you have the option to update the spend profiles for your customers. Depending on the profiles you set, this graph displays the number of customers in each profile. When setting up your account, there are default spend profiles. You can edit these profiles in the Customers section of your Settings.
Additional Resources
Videos
- Dashboard: Instruction Video

Updated 20 days ago